During the autumn semester of 2022, I was a part of an Intermediate Industrial Design course, informally known as Winter Market. Winter Market covers the practical application of industrial design for the consumer marketplace with a hands-on studio format where we focused on sustainable design, ethnographic design research, and consumer houseware goods. In the first half of the semester, our 16-person cohort was split into teams of 2 where we worked on the research that we would "give" to a designated team.
This post covers the ethnographic style design research I completed in this course. My partner, Katie Bush, and I decided to study "small spaces." Katie and I were known as team E, and we presented our findings and actionable insights to team F, who would use our research to create a houseware good to sell at Winter Market in December. After many weeks strengthening our research skills we were able to present the actionable insights that...
1. Restorative actions take up time, and in finding that some people want to get out of small spaces quicker...
How might design improve the speed of restorative actions or mitigate the need for such restorative actions?
2. When observing individuals in small (shared) spaces from a behavioral science standpoint, people frequently exhibited "negative body language," and knowing that this body language is often due to a lack of comfort and confidence in a space...
How might design make shared spaces more comfortable and enjoyable for the people sharing them?
How might design give people the security and confidence to feel comfortable in shared spaces?
3. When we look at people in small spaces, they organize and rearrange every subgroup of artifact in the space...
How might design make rearranging and organizing in small spaces (and spaces in general) easier?
Here is how we got to these findings:

A big world filled with small spaces!

As team E, I worked alongside my partner Katie Bush for the course of the semester.

Our topic was people in small spaces because as college students our personal experiences living in and having access to small spaces revealed areas of opportunity for design.

Our research plan consisted of Defining our topic and timeline, gathering data, analyzing our data through various methods and synthesizing it to provide insights, and presenting our findings to Team F.

This a snapshot of our research timeline.

We chose to define a small space as an area with no more than 30 square feet per person. An example of this is the Ohio State stadium which allows 5.24 square feet per person at full capacity.

Our methods and frameworks for gathering our data.

The small spaces we observed.

We shared an album of over 72 photos.

We took and shared 20 sets of notes using the 4 A’s framework template each time.

This is an example of how we took notes, observed and visualized a specific space. This is a kitchen in a house on 18th Avenue. We made a simple map of the artifacts in the space and visualized the movement of each person in the space throughout that hour. We put our observations in the actions category and entered what atmospheric qualities, artifacts and actors were present in the 4As template.

Once we gathered our observations for each space, we took the 4As out from our notes and put them onto sticky notes in Miro. We then grouped these actions, artifacts, atmospheric qualities and actors into appropriate subgroups.
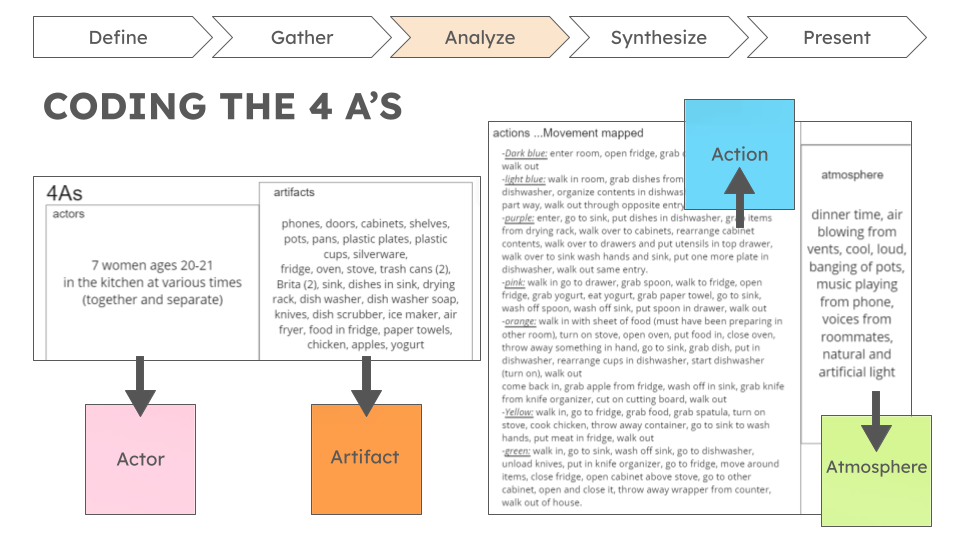
Here is a visual example of how we did this. These notes from the kitchen were placed on the appropriate sticky notes. Pink for actors, orange for artifacts, blue for actions and green for atmosphere.

After coding the 4 A’s, we were able to group the actors into 7 sub-groups.

We then grouped the artifacts into 11 sub-groups.

We grouped the atmospheres into 8 sub-groups.

And finally, we grouped the actions into 14 sub-groups.

Our first method to analyze our data was an Actions timeline analysis which concerns the actions, artifacts used during actions, and atmospheric qualities of the space.

We put the small space experience into 3 time zones. entering the space, in the space, and exiting the space. We then placed each action along the timeline appropriately and the type of action was categorized and color coded.

We categorized actions into either restorative action, which are actions taken to return the space back to its initial or desired condition, and other actions.
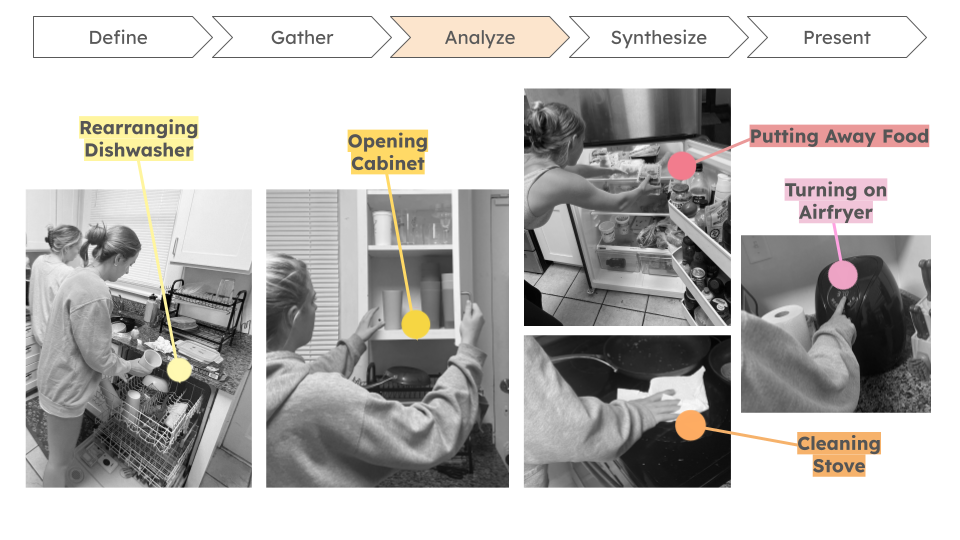
These restorative actions were broken down into organizing or rearranging, closing or opening something, taking out or putting away, turning something off or on, and cleaning.

We then took our actions sticky notes and placed them along the timeline where they occurred.

In condensing the timeline and making it easier to understand...

It becomes pretty obvious that these restorative actions take up time...

Assuming that some people want to get out of a small space quicker based on examples of our other actions...

Other action examples

Actionable insights

Moving on...our next method of Analysis was Silhouette Visualization, where we analyzed the photos taken in the shared spaces we observed. We then analyzed the body language of individuals within the photo.
We brought in some external research about negative body language, which is either a conscious or subconscious expression of negative feelings through bodily movement.

Examples of negative body language from our secondary research.

Our first visualization was done on the Buckeye Bus, where we analyzed and coded the body language of 7 individuals. This included looking down, being on phones, having headphones in, crossing legs, looking out of the windows, and reading.

Our next visualization was done on an Ohio State Football game, where the body language of 6 individuals in the student section were analyzed. You can see that some of the body language exhibited included: looking down, being on phones, having hands in pockets, crossing arms, facing the field, and talking.

Our next visualization was done on a line at Cedar Point Amusement Park where 14 people and their respective body language were analyzed. Some of this body language included: crossing arms, being on phones, having hands in pockets, standing with their back to the line bars, “grouping off” into smaller familiar groups, and talking.

Our last visualization was done on the Drackett Tower elevator, where only 2 individuals were analyzed for their body language, which included: looking down, being on phones, having hands in pockets, and facing the doors.

Insight

Actionable Insight

Finally, for our last analysis method we did a frequency chart analysis where we took our subgroups of actions and artifacts and oriented them along two axis and marked when a subgroup of artifact influenced a subgroup of action or vice versa. This analysis method was based on the sticky notes we had made from grouping the 4as.

Here is our frequency chart showing which subgroups impacted each other… and to help you better understand the insight we are about to get to we would like to show you what our sub-grouped artifacts were.

These subgroups were small devices, storage/organizers, appliances, cleaning supplies, food, toiletries, accessories, clothing, structures and furniture, utensils, and equipment.

In looking at these sub-grouped artifacts with the action of organizing and rearranging…you can see that this was the only occurrence where an action utilized all subgroups of artifacts, in other words all subgroups of artifacts were used in the action of organizing and rearranging.

Last Insight

Actionable Insight
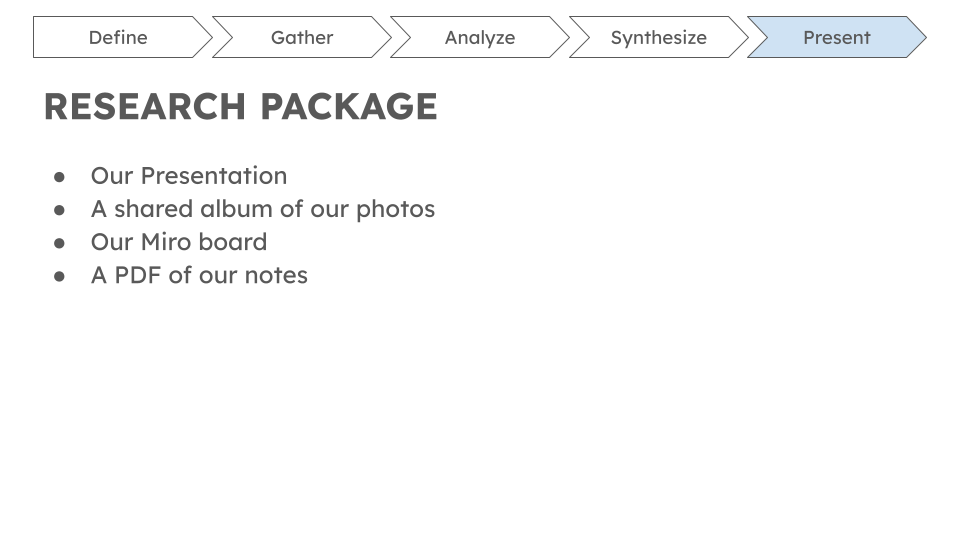
As mentioned, we handed these analyses, insights, and the rest of our research off to Team F. This included our presentation, the photos taken, our miro board notes, and a final PDF of our notes.

Finally, these are our references for our external research examples.
From this research and our insights, Team F was able to produce a set of coasters that will be added to this post shortly!